
Tableau
Tableau is a visual analytics platform transforming the way we use data to solve problems—empowering people and organizations to make the most of their data.
Product Type:
Product
Price Range:
€
€
€
€
€
Tableau
Tableau helps people and organizations be more data-driven
As the market-leading choice for modern business intelligence, our analytics platform makes it easier for people to explore and manage data, and faster to discover and share insights that can change businesses and the world.
Everything we do is driven by our mission to help people see and understand data, which is why our products are designed to put the user first—whether they’re an analyst, data scientist, student, teacher, executive, or business user. From connection through collaboration, Tableau is the most powerful, secure, and flexible end-to-end analytics platform.
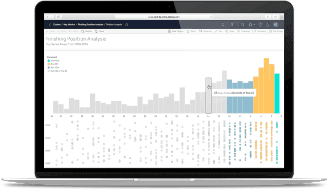
Big Data
Exploring and analyzing big data translates information into insight. However, the massive scale, growth and variety of data are simply too much for traditional databases to handle. For this reason, businesses are turning towards technologies such as Hadoop, Spark and NoSQL databases to meet their rapidly evolving data needs. Tableau works closely with the leaders in this space to support any platform that our customers choose. Tableau lets you find that value in your company’s data and existing investments in those technologies, so that your company gets the most out of its data. From manufacturing to marketing, finance to aviation- Tableau helps businesses see and understand Big Data.
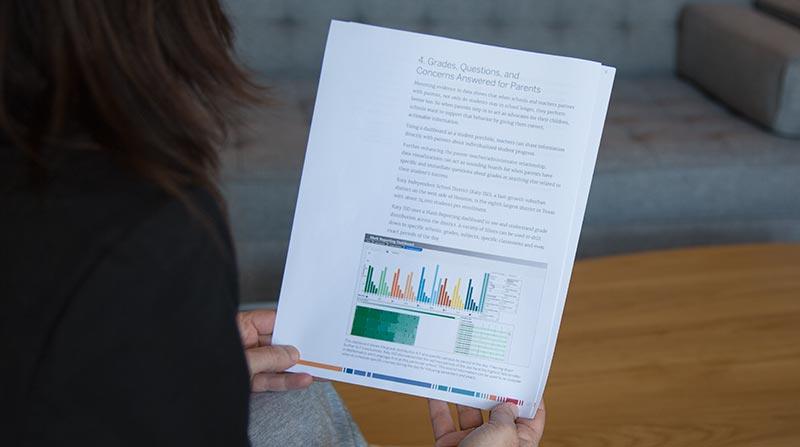
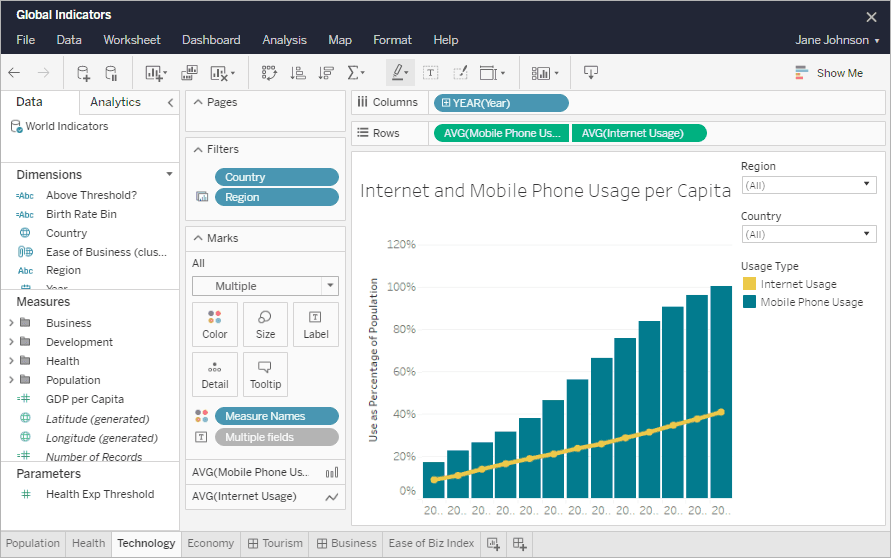
Business Dashboards
A good business dashboard informs with a glance. A great business dashboard combines high performance and ease of use to let anybody get data-driven answers to their deeper questions. Building dashboards with Tableau allows even non-technical users to create interactive, real-time visualizations in minutes.
In just a few clicks, they can combine data sources, add filters, and drill down into specific information. Sharing a dashboard requires no programming, whether it’s on Tableau Server, Tableau Cloud, or any portal or web page.
The best part is Tableau can connect to multiple live or extracted data sources, providing new opportunities for discovering new insights hidden in your data.
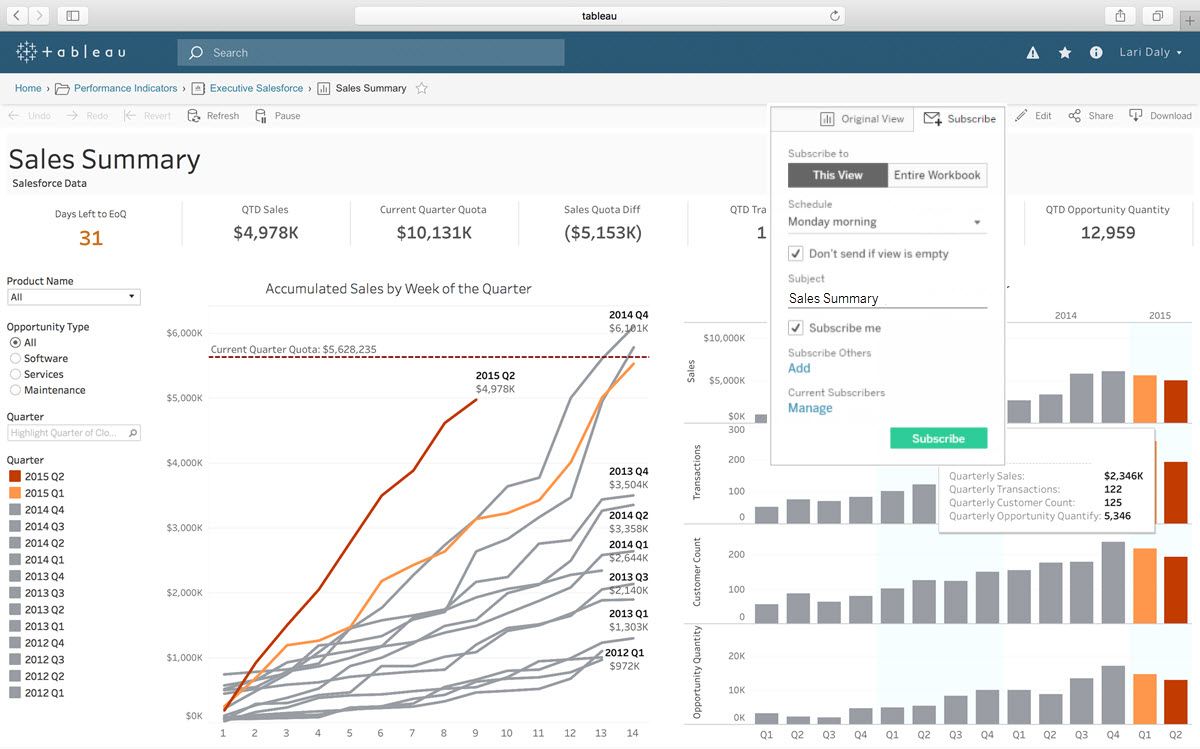
Collaboration
Data analysis shouldn't be an isolating task—that's why Tableau is built for collaboration. Team members are able to share data, make follow up queries, and forward easy-to-digest visualizations to others who could gain value from the data. Making sure everyone understands the data and is able to make informed decisions is critical to success. Tableau makes collaborating around data easy. From web editing and authoring to data source recommendations, give everyone the ability to engage with the data they need. Publish your dashboard to Tableau Server or Tableau Cloud in seconds, making it easy for everyone in your organization to see your insights, ask questions, and make decisions.
Maps
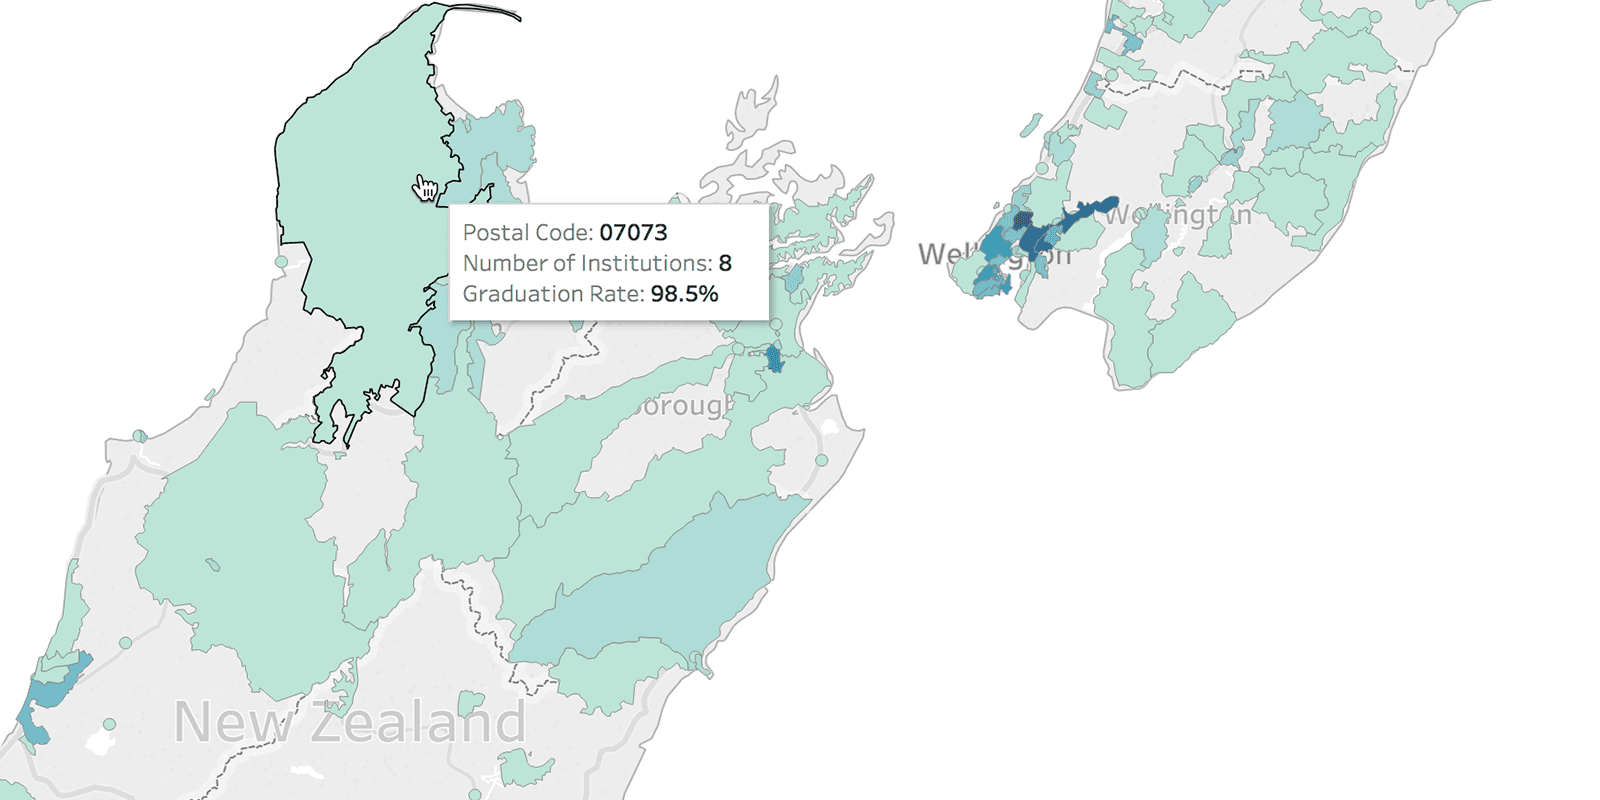
Tableau is designed to make the most of geographical data, so you can get to the “where” as well as the “why.” With instant geocoding, Tableau automatically turns the location data and information you already have into rich, interactive maps with 16 levels of zoom—or use custom geocodes to map what matters to your business. Census-based population, income, and other standard demographic datasets are built in. In the visual environment of Tableau, you can explore the world through data and share what you find in just a few clicks. You can even import geographic data from R or GIS (or whatever other spatial files or custom geocode data you have) and make it more easily accessible, interactive, and shareable via Tableau Cloud, Tableau Public, and Tableau Server.
Survey Analysis
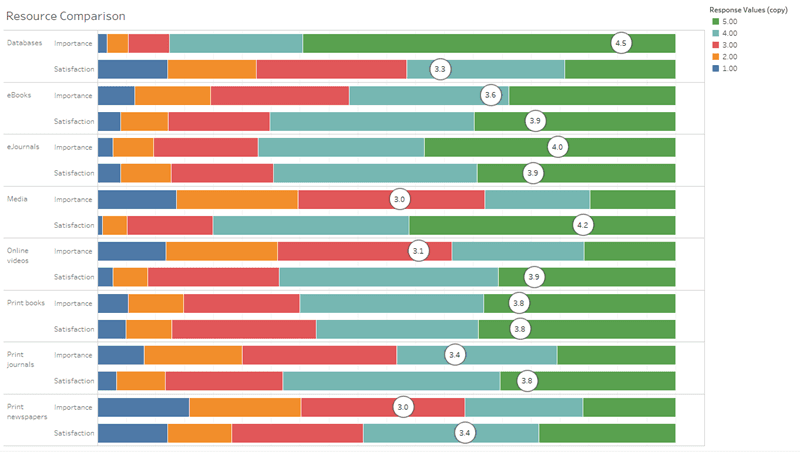
It’s easier than ever to perform surveys—and just as easy to get buried in survey data. Use Tableau to hear the voice of the customer coming through loud and clear. Tableau uses visual analysis as an interface to the data, which means anyone can investigate survey responses in-depth with key statistical measures built in. Zoom in and out of geographic regions and overlay census data with one button to find what’s unique about your audience. Then, share the experience with colleagues in one single comprehensive and interactive report that tells the story from every angle and at every level of drill-down. See how Tableau users conduct advanced survey analysis below.
Time Series Analysis
Time series analysis is crucial to understanding your data. The ability to look forward and backward, to drill down from years to days and see data trends over different periods of time is essential for the most comprehensive analysis. Tableau’s built-in date and time functions let you drag and drop to analyze time trends, drill down with a click, analyze times by day of the week, and easily perform time comparisons like year-over-year growth and moving averages.
Price Accessibility

Lease

Cloud
Deployment Type

Hosted

SaaS

On premise
Support

Email/Help Desk

FAQs/Forum

Knowledge Base

Phone Support

Chat

